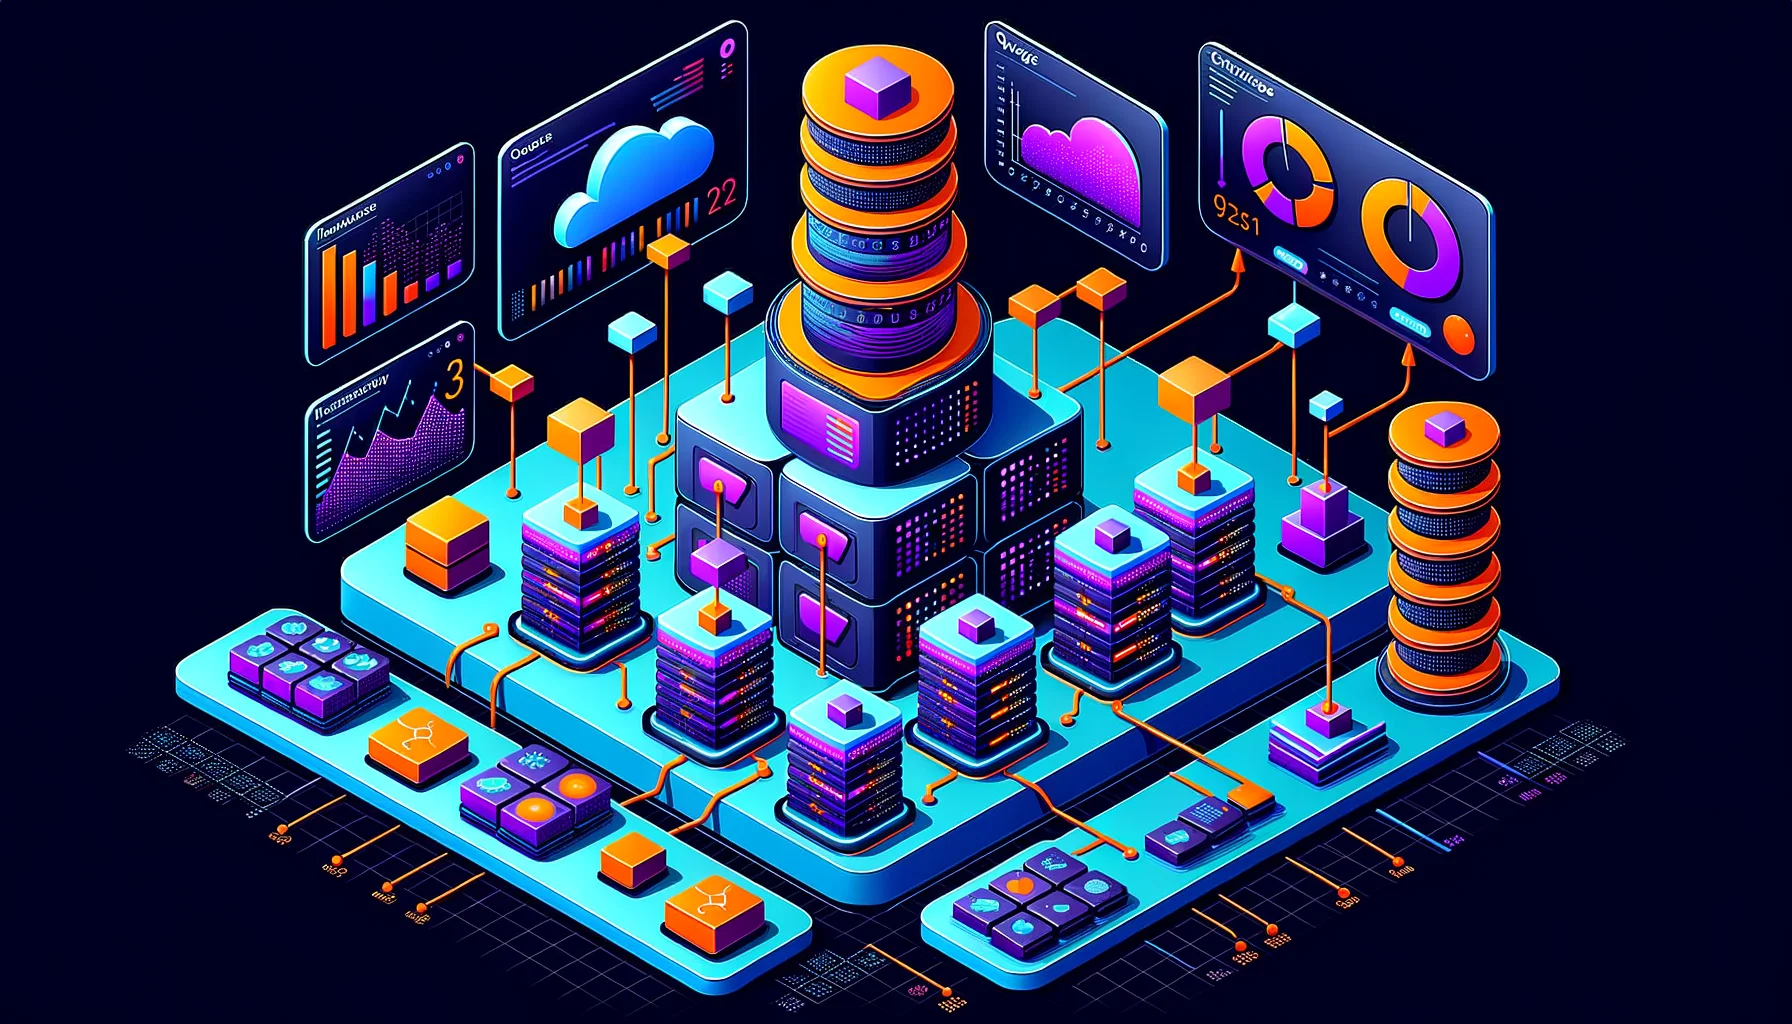
Prometheus and Thanos metrics architecture visualization

Prometheus and Thanos: Metrics at Scale

The first time someone asked me “was this slower last month than it is now?”, I had no answer. My Prometheus only remembered two weeks. The data I needed had already aged out of local disk and been deleted. That gap is the whole reason this post exists. Prometheus is the default for Kubernetes metrics, and for good reason. It works beautifully right up until you need long-term storage, or a view across multiple clusters, or genuine high availability. Then you meet the wall. ...
August 31, 2025 · 9 min read · Tom Meurs
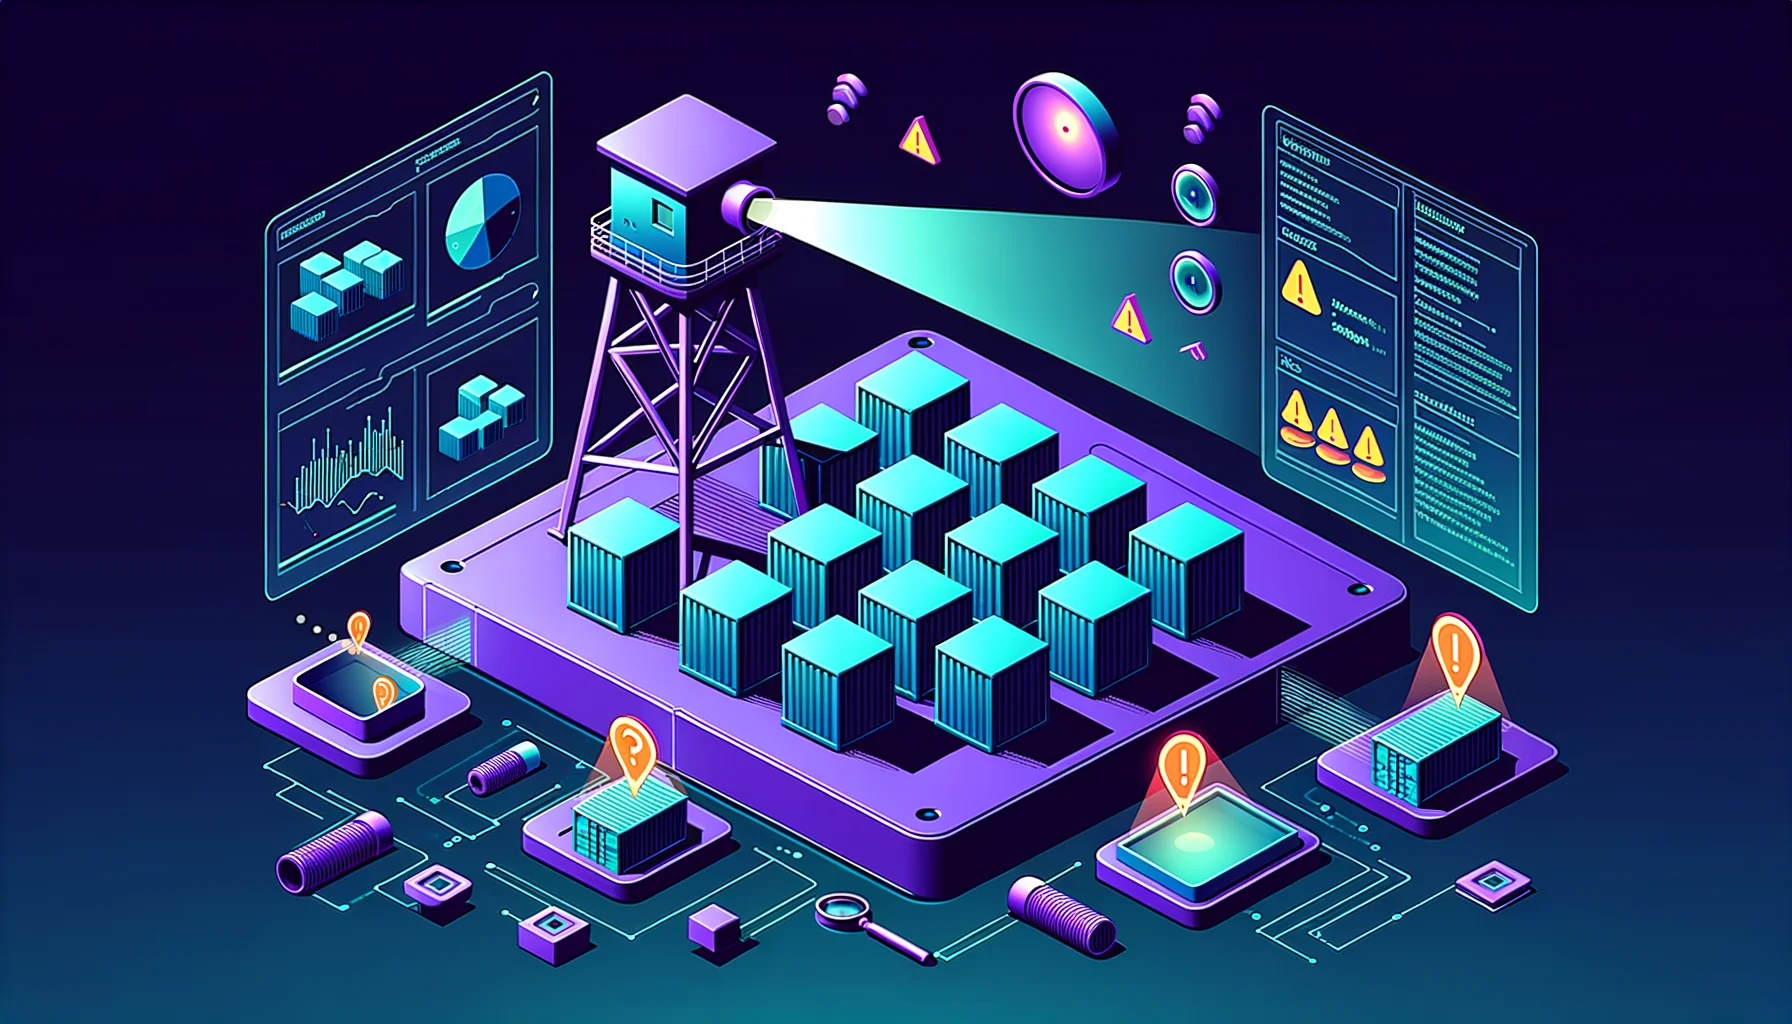
Falco runtime security monitoring visualization

Runtime Security with Falco: Detect Suspicious Behavior in Your Cluster

I scanned my images with Trivy. I enforced policies with Kyverno. My workloads got cryptographic identity through SPIFFE. Three layers of prevention, all green, and for a while that felt like enough. Then I started asking the uncomfortable question. What happens after a pod is running? My scanners checked the image that went in. My admission controller checked the spec at deploy time. Neither of them is watching once the process is actually executing. If a container gets popped by a zero-day at 3am, every one of those controls has already done its job and gone home. ...

August 7, 2025 · 13 min read · Tom Meurs